
We are excited to announce a major update to the Patterns ID web app: the Conditional Statistics™ Inspector. This new feature provides a deeper and more interactive analysis of market trends, helping you refine your trading strategies.
Conditional Statistics™ Table
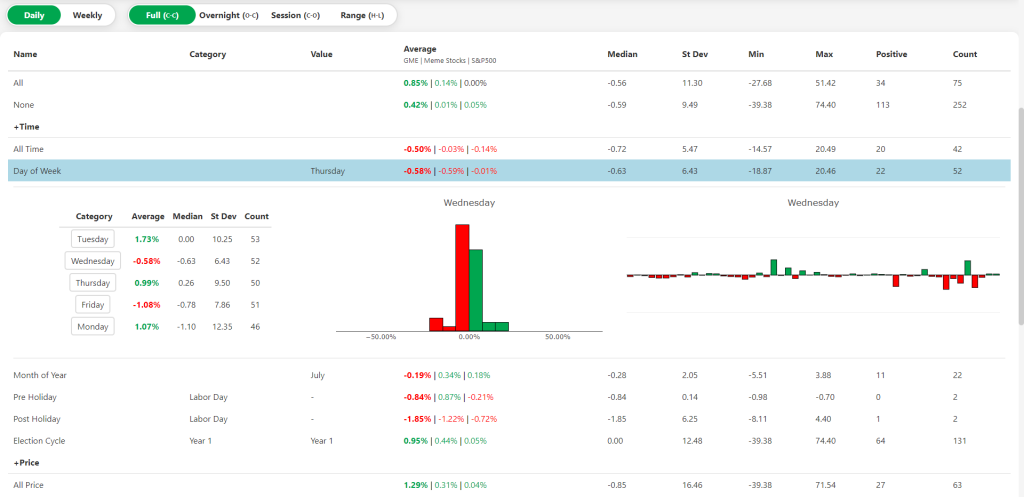
The Conditional Statistics™ Inspector window now includes a detailed table displaying Conditional Statistics™ for all categories related to the selected indicator. This table helps you understand how different conditions have historically affected price changes, offering a comprehensive view of the data at a glance.
Historical Percent Price Change Histogram
One of the standout features of the Inspector is the histogram. It visually represents the historical price percentage changes given the currently selected conditions. This allows you to quickly grasp the distribution and frequency of price changes, aiding in the identification of patterns and trends.
Historical Price Changes Bar Chart
In addition to the histogram, the Inspector includes a bar chart that also shows historical price changes. This bar chart provides a clear visual tool for tracking trends over time and helps you analyze past performance under different conditions.
Explore the New Feature
To experience the new Conditional Statistics™ Inspector, simply navigate to the dashboard page and click on any indicator. The Inspector window will open below the row, offering a wealth of data and insights. You can update the histogram and bar chart by clicking on any category in the table, allowing for dynamic and interactive exploration of different conditions and their impacts.
We are committed to continuously enhancing the Patterns ID web app to better serve your needs. The Conditional Statistics™ Inspector is just another stepping stone of many innovative features we plan to release. Stay tuned for more updates and thank you for being a valued member of the Patterns ID community!