Summary
The Screener page on the Patterns ID web app is a powerful tool for identifying stocks that meet your specific criteria. By using screener rows to define your filters, you can find stocks that align with your trading strategies. The results table provides a detailed view of the stocks that match your requirements. Explore the Screener page to discover new trading opportunities and enhance your analysis with Conditional Statistics™.
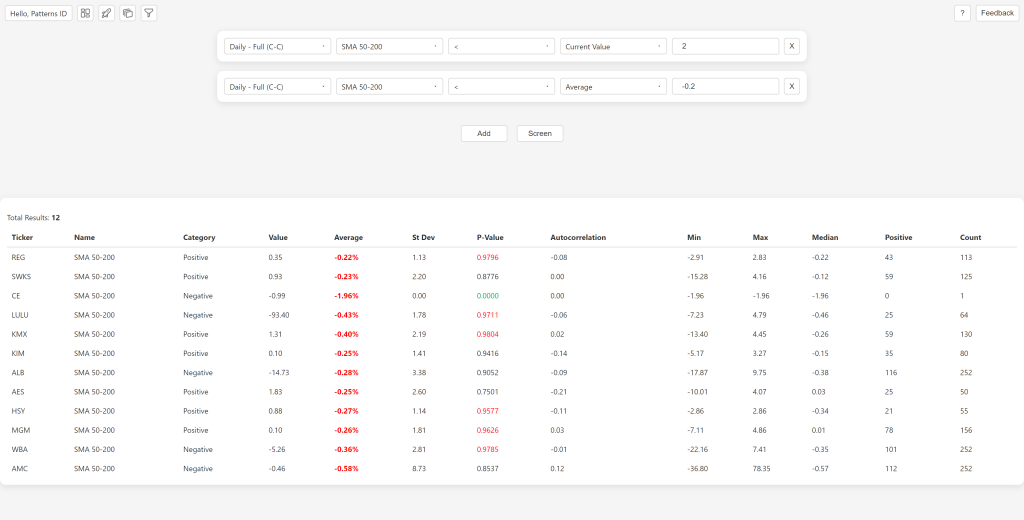
Screener Rows
The Screener page is driven by screener rows, each allowing you to set specific criteria for filtering stocks. By adding one or more screener rows, you can create intricate filters that pinpoint the most relevant stocks. Here are the key components of a screener row:
- Timeframe: Choose the timeframe for building Conditional Statistics™. Options include daily/weekly and various sub-timeframes.
- Indicator: Select the indicator used for screening stocks.
- Comparison: Use a comparison operator (e.g., >, <, =) to set your criteria.
- Stat: Define the statistic of the indicator to compare.
- Value: Specify the value of the statistic for comparison.
Each screener row combines these elements to filter stocks according to your precise specifications.
Row of Buttons for Managing the Screener
To make managing your screener easier, a row of buttons is provided: Add, Screen and Clear. These buttons allow you to add new screener rows, run the screener, and clear the results table.
Conditional Statistics™ Table
The results of your screener are displayed in a comprehensive table that includes a count of the total results and a list of all tickers that meet the screen requirements. This table provides a detailed view of the stocks that match your criteria and displays all statistics for the screened indicator, making it easy to analyze and compare them.