Summary
The Stock Dashboard page is a powerful tool for retail traders to analyze individual stocks using Conditional Statistics™. By utilizing the features on this page, you can gain a deeper understanding of stock performance and uncover valuable insights to guide your trading strategies. Be sure to explore the different timeframes and sub-timeframes to fully leverage the Conditional Statistics™ available on the Patterns ID web app.
Ticker Input Field
At the top of the Stock Dashboard page, you’ll find an input field where you can enter the ticker symbol of the stock you’re interested in analyzing. This field makes it easy to quickly access data for any stock in our database. Additionally, there’s a dice button next to the input field that, when clicked, will randomly select a ticker for you. This feature is perfect for discovering new stocks or conducting random analyses.
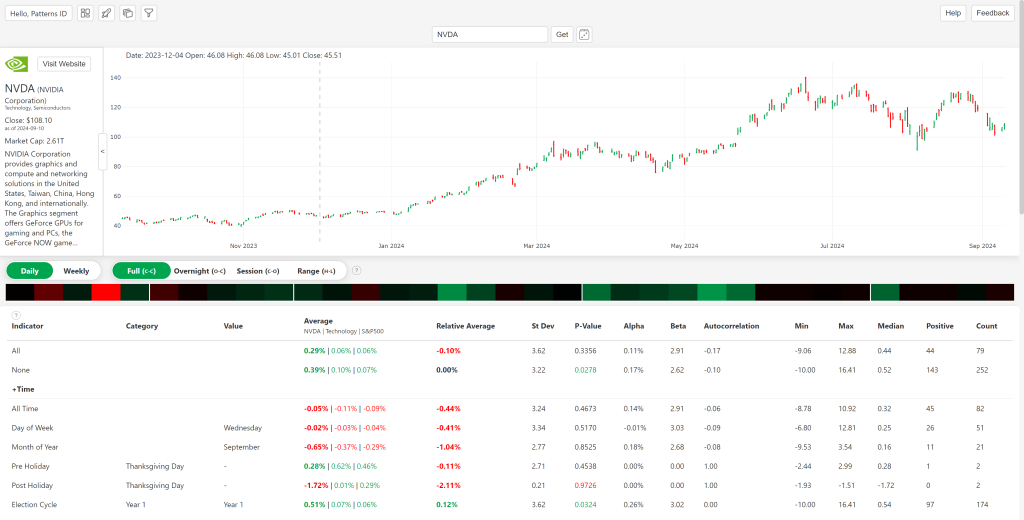
Company Summary & Bar Chart
Below the ticker input field, you’ll first see a company summary next to a bar chart displaying the daily (or weekly) prices for the selected stock over the past year. The company summary consists of the ticker, logo, company name, last close price, market cap, link to their website, and description of the business. A button accompanies the summary window to expand or collapse the content as needed. The chart is interactive, allowing you to hover over specific bars to see the exact price data for each day. Additionally, the bar chart displays historical indicator values when a row is selected in the Conditional Statistics™ table.
Timeframe Toggles
Below the bar chart, there are toggles that let you select the timeframe for the Conditional Statistics™. You can choose between daily and weekly data, giving you the flexibility to analyze short-term or longer-term trends. Additionally, there are sub-timeframe options to refine your analysis further:
- Full: Analyzes the full period from close-to-close.
- Between: Focuses on the time between the previous close and the current open.
- Inside: Looks at the period from the current open to the current close.
- Range: Evaluates the high-to-low range within each period.
Heatmap
Below the toggles is a heatmap of all conditional averages for this ticker. The conditional averages are grouped by their type just as they are grouped in the table below it. The heatmap gives users a visual cue to all of the conditional averages without having to scan through the table, allowing users to quickly determine if they want to learn more about the indicators or not.
Conditional Statistics™ Table
At the bottom of the Stock Dashboard page, you’ll find a comprehensive table displaying all the Conditional Statistics™ for the selected stock. This table includes a variety of metrics that provide insights into the stock’s historical performance under various conditions. You can use this data to identify patterns and trends that may inform your trading strategies.
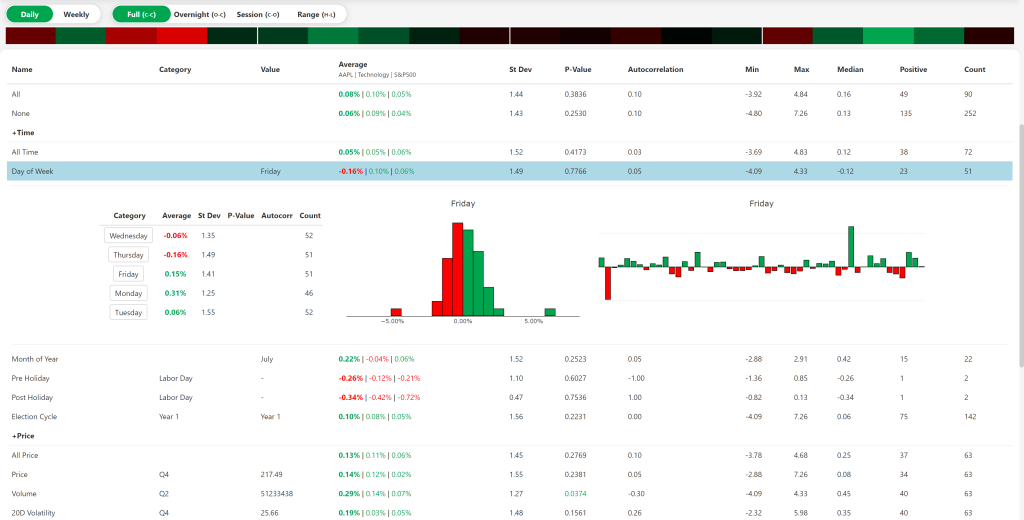
Conditional Statistics™ Inspector
If you click on an indicator row in the Conditional Statistics™ table it opens the Conditional Statistics™ inspector window where you can learn more about the indicator’s trading history. On the left is a table that includes a few statistics for each category for that indicator. For example, below is an inspector window for the ‘day of week’ indicator and each row is a different day of the week. Each row’s category can be clicked to update the graphs in the inspector window. The graph on the left is a histogram of the currently selected category, showing the general return structure under that condition. Next to this is the historical returns graph which shows the historical returns in chronological order for that condition. Users can open the inspector window to understand more about the history of the current category for any indicator while also comparing it to other categories, looking across Conditional Statistics™ and historical return structures.