Summary
The Sector page is an invaluable tool for traders looking to analyze and compare the performance of different sectors within the S&P 500. By utilizing the interactive daily line chart and the detailed table of Conditional Statistics™, you can gain insights into sector trends and make more informed trading decisions. Be sure to explore the various timeframes and sub-timeframes to fully leverage the analytical power of Conditional Statistics™ on the Patterns ID web app.
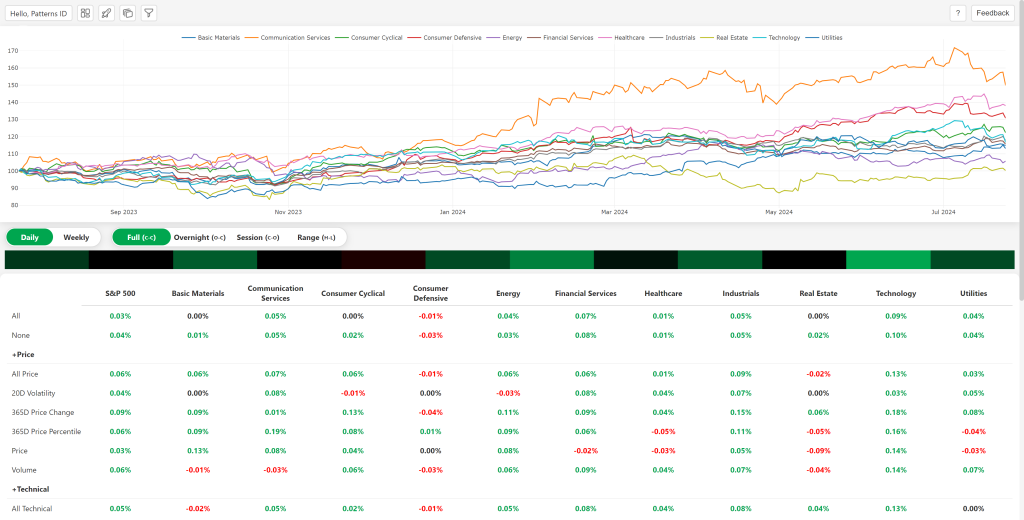
Sectors Line Chart
At the top of the Sector page, you’ll find a daily line chart that displays the performance of all sectors within the S&P 500 over the past year. The prices have been indexed so all sectors start at 100. This interactive chart allows you to track the trends and movements of different sectors, providing a comprehensive view of sector performance. Hover over specific points on the lines to see detailed daily data for each sector.
Timeframe Toggles
Below the line chart, there are toggles that let you select the timeframe for the Conditional Statistics™. You can choose between daily and weekly data, giving you the flexibility to analyze short-term or longer-term trends. Additionally, there are sub-timeframe options to refine your analysis further:
- Full: Analyzes the full period from close-to-close.
- Between: Focuses on the time between the previous close and the current open.
- Inside: Looks at the period from the current open to the current close.
- Range: Evaluates the high-to-low range within each period.
Heatmap
Below the line chart and toggles is a heatmap displaying the ‘All’ conditional averages for each sector and the S&P 500. The heatmap is a visual cue to the general direction of conditional averages across the sectors and as a whole, giving users an immediate sense of the statistics below.
Conditional Statistics™ Table
Below the heatmap, you’ll find a table that displays all Conditional Statistics™ for each sector and the S&P 500. These statistics are calculated by averaging the data for each stock within a sector or across the entire S&P 500 for each indicator. The table provides a detailed comparison of sector performance under various conditions and gives insight into larger trends of the market.