Summary
The Min Max page is an essential tool for traders looking to analyze the best and worst performing stocks in the S&P 500 based on historical data. By utilizing the comprehensive tables for maximum and minimum Relative Conditional Averages, you can gain valuable insights into historical stock performance and identify potential opportunities through outliers. Be sure to explore different timeframes and sub-timeframes to fully leverage the power of Conditional Statistics™ on the Patterns ID web app.
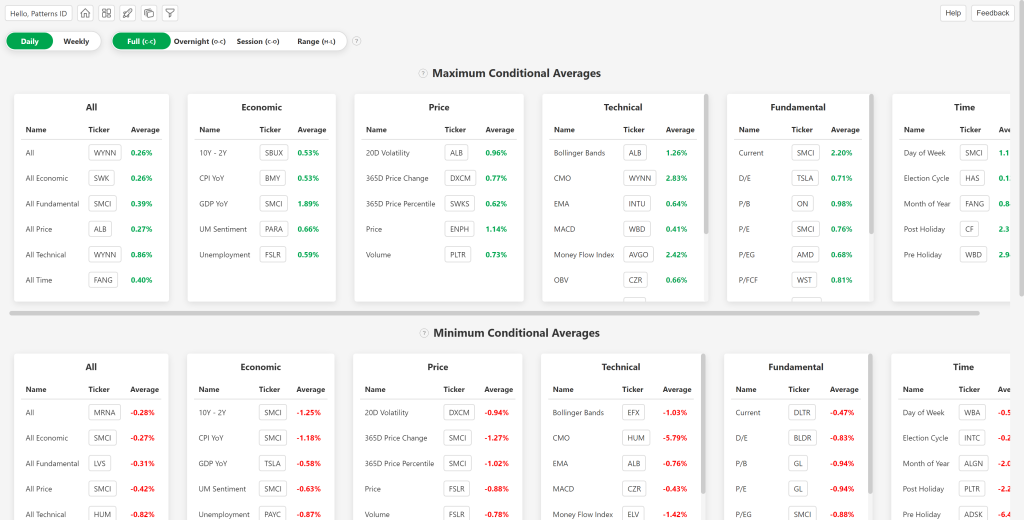
Timeframe Toggles
Below the bar chart, there are toggles that let you select the timeframe for the Conditional Statistics™. You can choose between daily and weekly data, giving you the flexibility to analyze short-term or longer-term trends. Additionally, there are sub-timeframe options to refine your analysis further:
- Full: Analyzes the full period from close-to-close.
- Between: Focuses on the time between the previous close and the current open.
- Inside: Looks at the period from the current open to the current close.
- Range: Evaluates the high-to-low range within each period.
Maximum Relative Conditional Averages
The first results section on the Min Max page displays the Maximum Relative Conditional Averages. This section highlights the most positive relative conditional averages across all stocks in the S&P 500. The relative average is the conditional average less the unconditional average and aims to reduce noise from stocks with historically strong momentum. By examining these values, you can identify the stocks that have historically shown the strongest relative positive performance under specific conditions.
Minimum Relative Conditional Averages
The second results section on the Min Max page displays the Minimum Relative Conditional Averages. This section focuses on the most negative relative conditional averages across all stocks in the S&P 500. The relative average is the conditional average less the unconditional average and aims to reduce noise from stocks with historically strong momentum. By examining these values, you can identify the stocks that have historically shown the weakest relative performance under specific conditions.
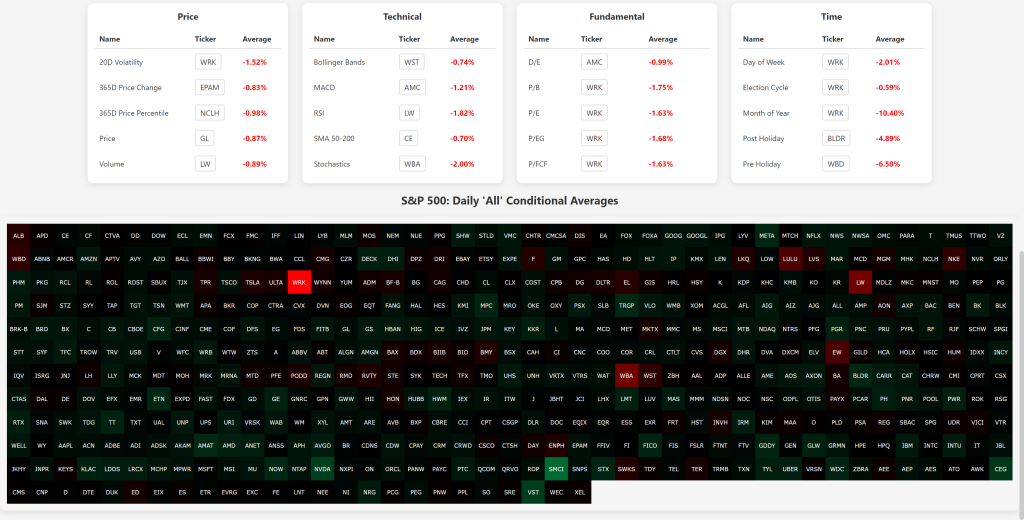
S&P 500 Heatmap
Below the maximum and minimum relative conditional averages is a heatmap of the ‘All’ conditional averages of each stock in the S&P 500. The ‘All’ conditional average combines all of the indicators’ conditional averages for a single stock (pre and post holiday stats are excluded). The heatmap allows users to search across the S&P 500 to discover outliers that have excessive relative conditional averages.